- Fixed Income
- Who We Serve
- Capital Markets
- Current Offerings
- Weekly New Issues
- Certificates Of Deposit
- Incapital InterNotes® / Corporate Debt
- Impact Investments
- Municipals
- Preferreds
- Sovereigns, Supranationals And Agencies (SSA)
- Investor Education
- Wealth Management Solutions
- BondNav®
- About
09.01.2023 – Rate Inflate
Fixed Income Market Insights
Key Takeaways
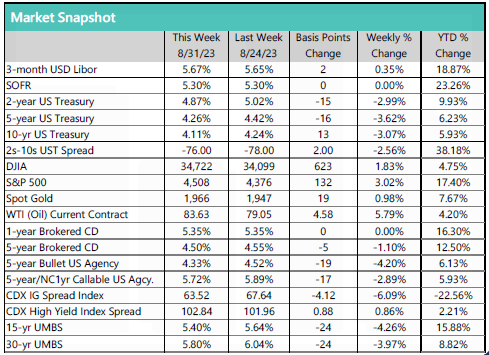
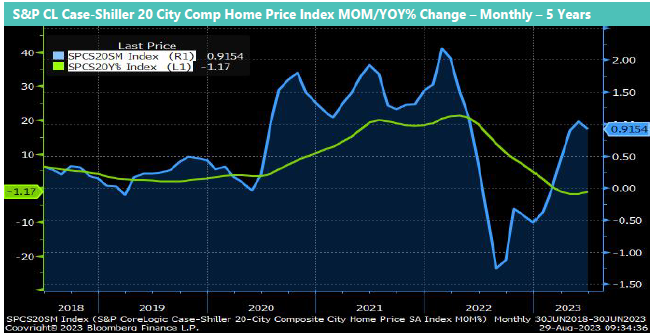
with GT2s down 15 basis points and GT10s lower by 13 basis points respectively and 2s/10s less inverted by 2 basis points (-76), driven by softer consumer confidence and JOLTS job openings. On the data front, the S&P CoreLogic Case-Shiller 20-city home price index rose +0.92% in June, the fourth consecutive monthly gain and second largest since May 2022, as the union of rock-bottom affordability and higher mortgage rates has been offset by historically thin inventories and resilient demand. Consumer confidence weakened during August and came in below consensus at 106.1, the lowest level in three months, driven by softer labor market expectations and the recent surge in market interest rates, conditions that threaten to upend this summer’s resilience in consumer spending. The number of available jobs came in much weaker than expected during July at 8.83 million, the lowest level since March 2021, as excess labor demand continues to dissipate via the reduction of job vacancies rather than increasing layoffs and unemployment. Headline PCE prices came in as expected during July and were up +0.2%, as lower durable goods prices were offset by advances in food, energy, housing, and other services.
We Suggest
We continue to prefer playing defense given elevated inflationary expectations and the likelihood of elevated short-term interest rates in the quarters to come. We favor barbell strategies in securitized products, anchored by short, higher current cash flow assets and longer, high quality bonds.
Author
David Petrosinelli, CFA
Managing Director
Senior Trader, InspereX
Rate Inflate
As a summer jam packed with non-traditional economic and geopolitical news rapidly comes to a close, one of the more noteworthy events has been the precipitous rise of U.S. Treasury (UST) note yields. Indeed, yields on benchmark 2- and 10-year USTs rose to their highest levels since 2007,
both up 46 basis points since the end of May. While rising market yields for longer-dated USTs during the early stages of any FOMC tightening cycle are commonplace, what makes this latest leg up unique is that it has occurred during the late stages of the most aggressive monetary policy tightening in 40 years and, more importantly, during a sustained period of
moderating inflationary expectations.
To start, economic activity has been slow to cool, opening the door for more monetary policy tightening and encouraging policymakers to maintain their ‘higher for longer’ stance regarding interest rates, partly explaining the recent move up in rates, particularly in the front-end of the yield curve. Regarding longer-dated USTs, the main culprit driving higher
yields has been the worsening fiscal landscape, which triggered Fitch Ratings to cut the sovereign debt rating of the United States government below AAA (now AA+) for just the second time in history, matching the move made by Standard and Poor’s (S&P) in 2011.

Indeed, Fitch noted “the expected fiscal deterioration over the next three years, a high and growing general government debt burden, and the erosion of governance relative to ‘AA’ and ‘AAA’ rated peers over the last two decades that has manifested in repeated debt limit standoffs and last-minute
resolutions.” While UST yields have receded this week on the heels of weaker consumer confidence and JOLTS job opening data, this summer’s jump in rates, if sustained, will further squeeze consumers and businesses already burdened by higher, post-pandemic inflation.
Taken together with additional headwinds that include depletion of pandemic-era excess savings, October’s resumption of federal student loan payments and soaring credit card debt, suffice it to say that the risks of a meaningful contraction in consumer spending have risen over the summer – conditions that threaten to derail what has been a surprisingly resilient economy despite 525 basis
points of FOMC tightening over the past 18 months. Happy Labor Day!
All quiet on the fiscal front as Congress remains in summer recess until September 5th. Away from that, the Biden administration continues to push plans to cancel $39 billion of certain federal student loan debt for more than 800,000 borrowers, citing the Higher Education Act of 1965 as enabling legislation. As expected, the first lawsuit challenging the legality of this latest forgiveness plan was filed at the beginning of August by the New Civil Liberties Alliance (NCLA), who argued that the proposed plan violates the Constitution’s Appropriations Clause, which affords Congress the sole authority to cancel debt owed to the U.S. Treasury. As with the Administration’s larger Executive Order
that was ultimately struck down by the Supreme Court, the NCLA lawsuit was dismissed two weeks ago by a U.S. circuit court, the first venue prior to appeals, with the judge stating that the plaintiffs lacked standing to bring suit. Like the Executive Order, we expect an appeal to the Supreme Court in the fall. Stay tuned!

The S&P CoreLogic Case-Shiller 20-city home price index rose +.92% in June ( +.80% est./-1.17% YOY), the fourth consecutive monthly gain and second largest since May 2022, as the union of rock-bottom affordability and higher mortgage rates has been offset by historically thin inventories and resilient demand. While price moderation was widely expected given the steep rise in prices from mid-2020, housing market technicals continue to be very favorable as supply remains tight in many areas (3.3 months in July/record low 1.8), listings continue to sell quickly (20 days on market in July/record low 14), and the rental market remains robust. Regarding inventories, July’s existing home sales data revealed that there were just 1.11 million previously owned homes for sale, down nearly 15% since last July (cycle low 850,000, Jan. 2022), affording a meaningful tailwind for home prices in the months to come. In total, 10 of the 20 cities continued to show annual price gains, albeit well-off of their cycle highs last year, with Chicago (+4.2%), Cleveland (+4.1%), and New York (+3.4%) posting the largest annual gains, with Las Vegas (-8.2%), Seattle (-8.8%), and San Francisco (-9.7%) rounding out the bottom three. On a national basis, the housing price index fell -.02% for the year ended June, the third consecutive month of annual declines and a sharp reversal from last March’s 20.8% all-time record high (1988 index inception). Looking at the text of the report, a director of the survey stated that “Acceleration in home prices was most notable in markets that remained relatively affordable throughout the pandemic and that saw less shifts as a result of household migration, such as those in the Midwest and New England. Home prices in these markets are now catching up with traditionally more expensive ones,” and that “We recognize that the market’s gains could be truncated by increases in mortgage rates or by general economic weakness, but the breadth and strength of this month’s report are consistent with an optimistic view of future results.” All in all, while investors expected lower home prices given the steep rise in mortgage rates and the magnitude of price appreciation during the pandemic, the union of tight supply and still-resilient demand have supported prices since the start of the year.
The Week Ahead
The data calendar slows over the coming week, headlined by Non-Farm Payrolls, ISM Services, and Weekly Jobless Claims. Looking ahead, markets remain focused on inflation, employment data and signs of weakening economic activity. On the new issue front, no deals were priced during the last week of August after nearly $24 billion launched during the preceding three weeks and $192 billion year to date ($208 billion over same period last year; $276.7 billion for 2022), and IG corporate issuance slowed dramatically with just $1 billion priced through the 31st and $902.6 billion year to date ($972.3 billion over same period last year; $1.26 trillion for 2022). While new issue supply has slowed this year given FOMC rate hikes and elevated volatility, market conditions have normalized post first-quarter bank failures, and the new deal landscape remains favorable for a wide array of ABS and corporate issuers as investor demand remains robust.
Friday 9/1 – Non-Farm Payrolls; ISM Manufacturing
Monday 9/4 – Market Holiday- Happy Labor Day
Tuesday 9/5 – Factory Orders
Wednesday 9/6 – ISM Services; MBA Mortgage Applications
Thursday 9/7 – Weekly Jobless Claims